


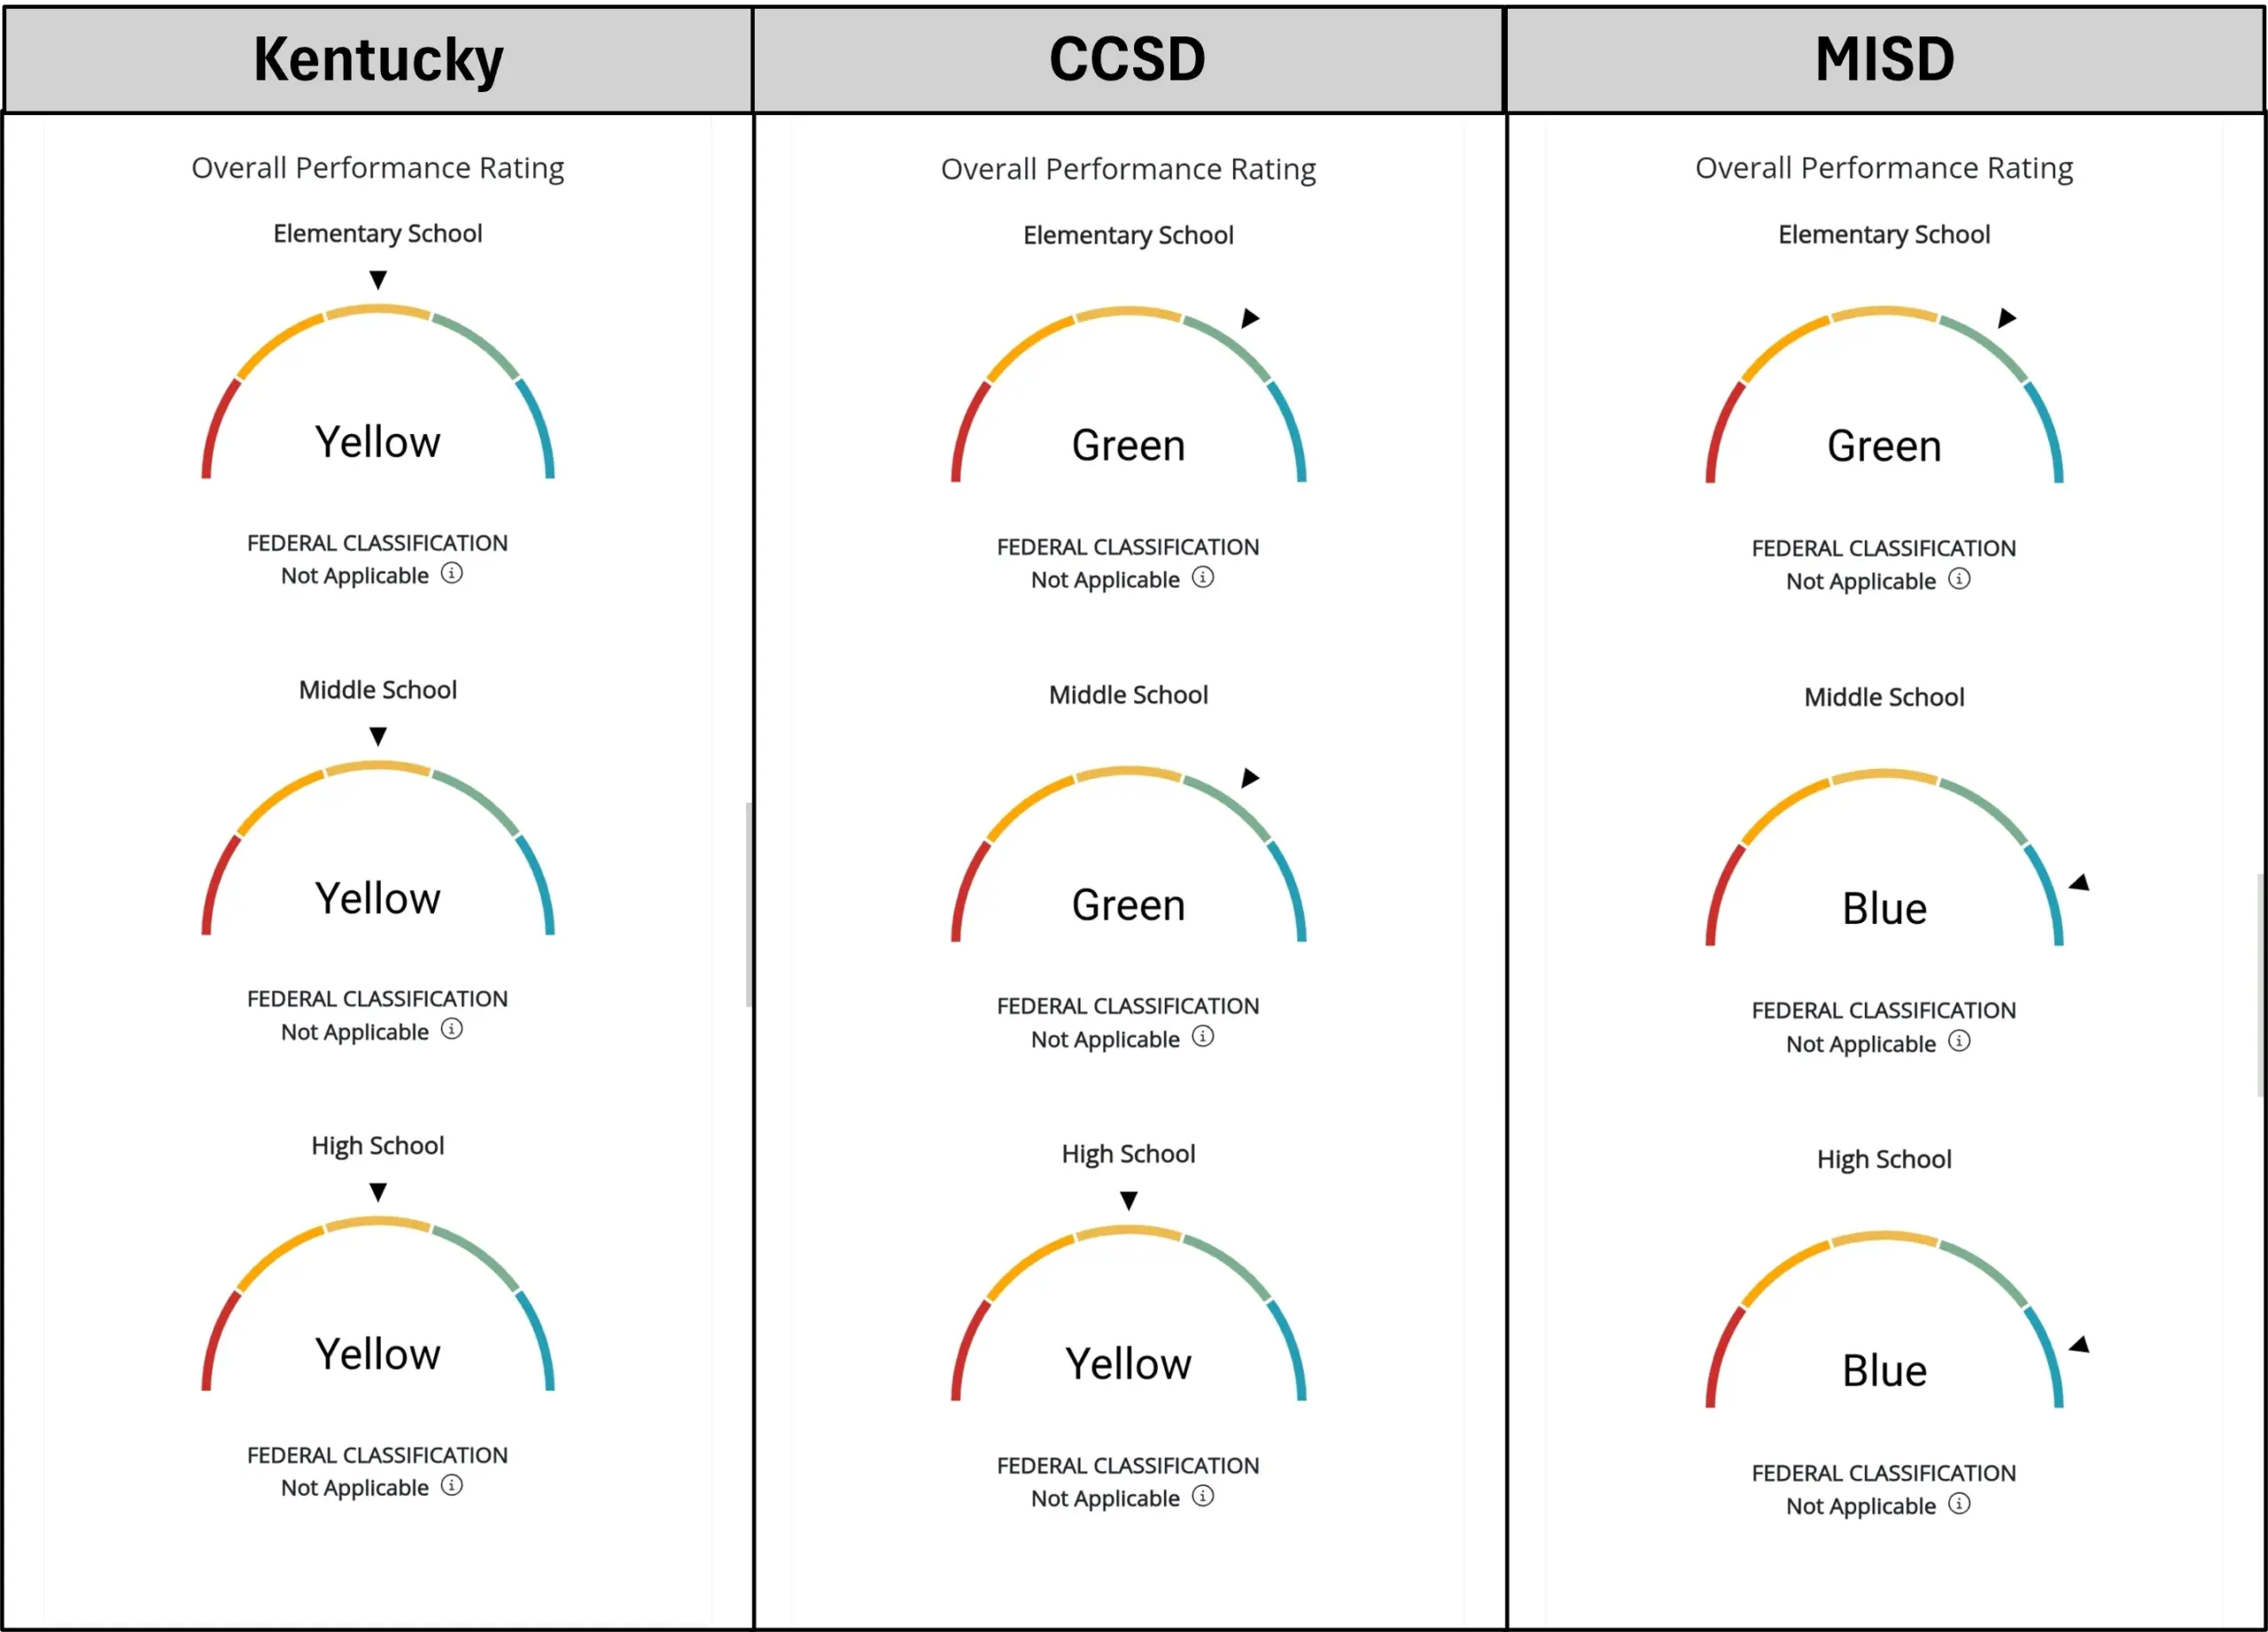
MURRAY – Newly released assessment and accountability data from the Kentucky Department of Education (KDE) for the 2024-2025 school year show students across the Commonwealth performed better last year across many subjects and grade levels than they have in recent years. Looking locally, Calloway County School District and the Murray Independent School District performed above the state average in nearly all areas.
“I am proud of the commendable performance Kentucky students demonstrated during their assessments,” Commissioner of Education Robbie Fletcher said in a press release. “Our KDE staff has shown a strong commitment to delivering innovative programs, comprehensive training and consistent support for educators throughout the Commonwealth. I want to express my appreciation to the many educators who have participated in initiatives such as the Kentucky Reading Academies, and I am pleased with the positive progress we are making.”
KDE: 2024-2025 assessment and accountability data summary
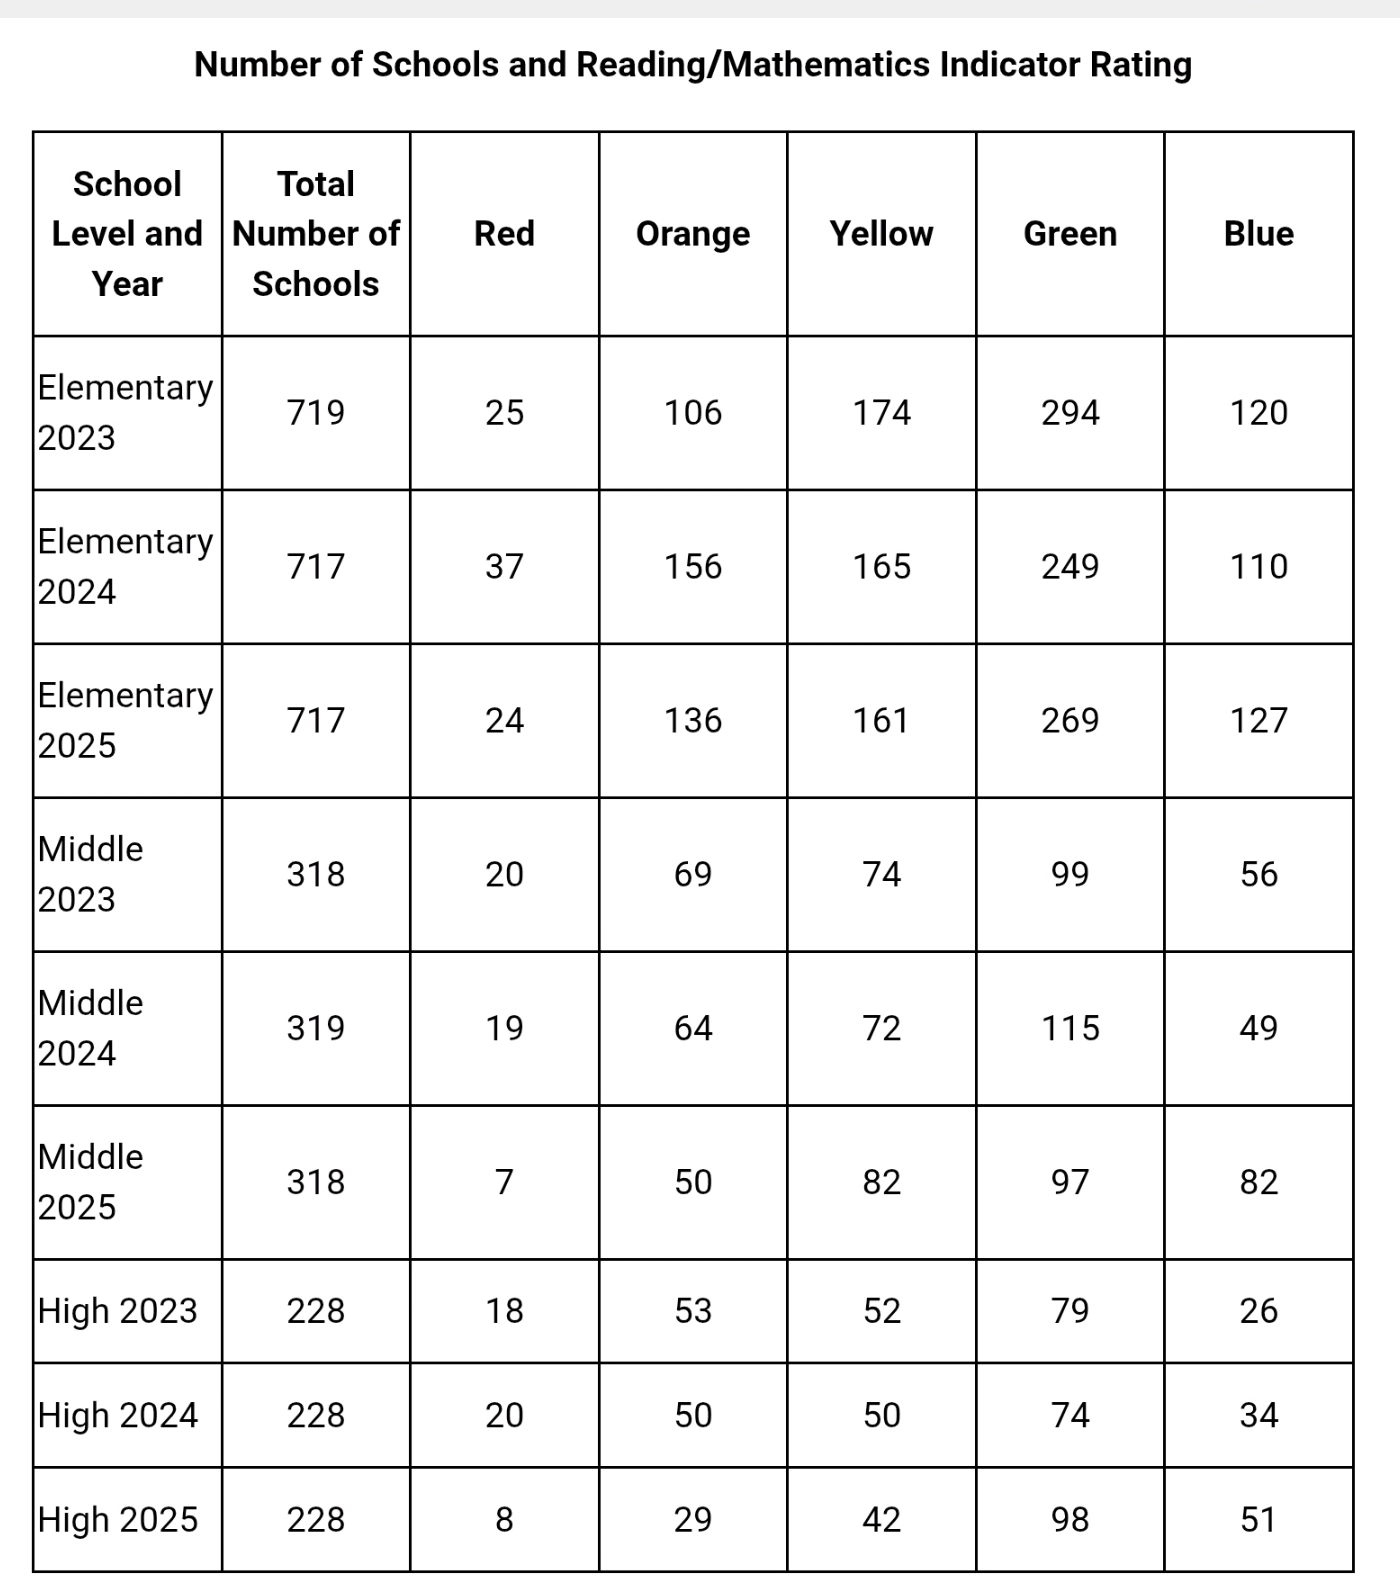
During the 2024-2025 school year, Kentucky public school students in grades 3-8, 10 and 11 took assessments called the Kentucky Summative Assessments and the Alternate Kentucky Summative Assessments in reading, mathematics, social studies, science, editing and mechanics, and on-demand writing. Students take reading and mathematics assessments annually in grades 3 through 8, and in grade 10. Other subjects are assessed once per grade level, with social studies, editing and mechanics, and on-demand writing assessed in grades 5, 8 and 11. Science continued to be assessed in grades 4, 7 and 11.
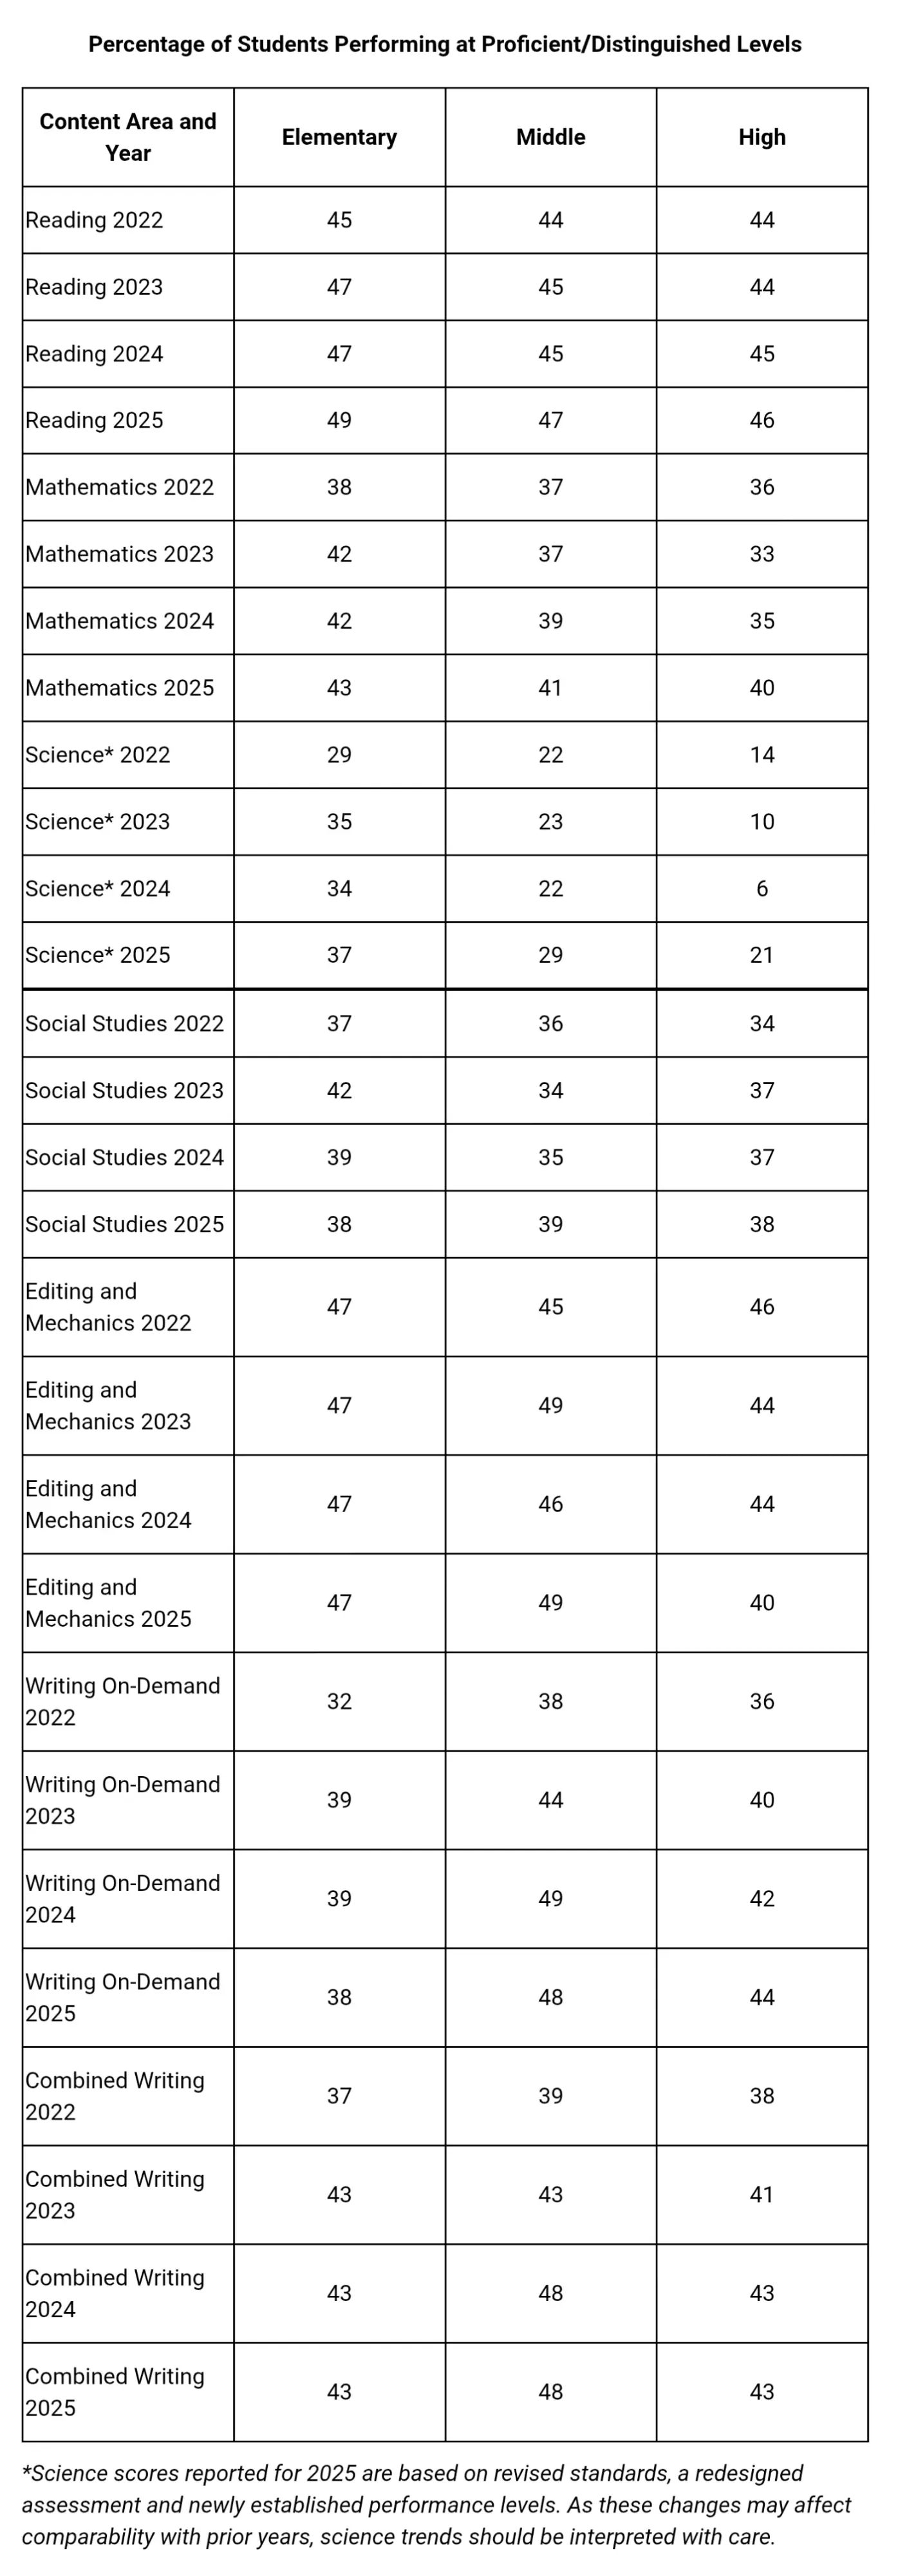
Kentucky students performed at proficient or distinguished levels at a higher rate during the 2024-2025 school year in reading and mathematics than they have in previous years. Several other categories were either slightly above or slightly below where they were in the 2023-2024 school year.
Kentucky is currently in its third year of full implementation following revisions made to KRS 158.6455 by the Kentucky General Assembly in 2020. The accountability system features Status and Change as ways to evaluate state indicators; Status being the current-year performance and Change representing year-to-year progress.
Results are shared through a color-coded dashboard with five colors: blue, green, yellow, orange and red, in order from highest to lowest ranking.
“At the heart of Kentucky’s accountability system is a commitment to students,” Fletcher said. “The system is designed to ensure that every learner is well-rounded, equipped with essential skills and prepared for success in college, career and beyond.”
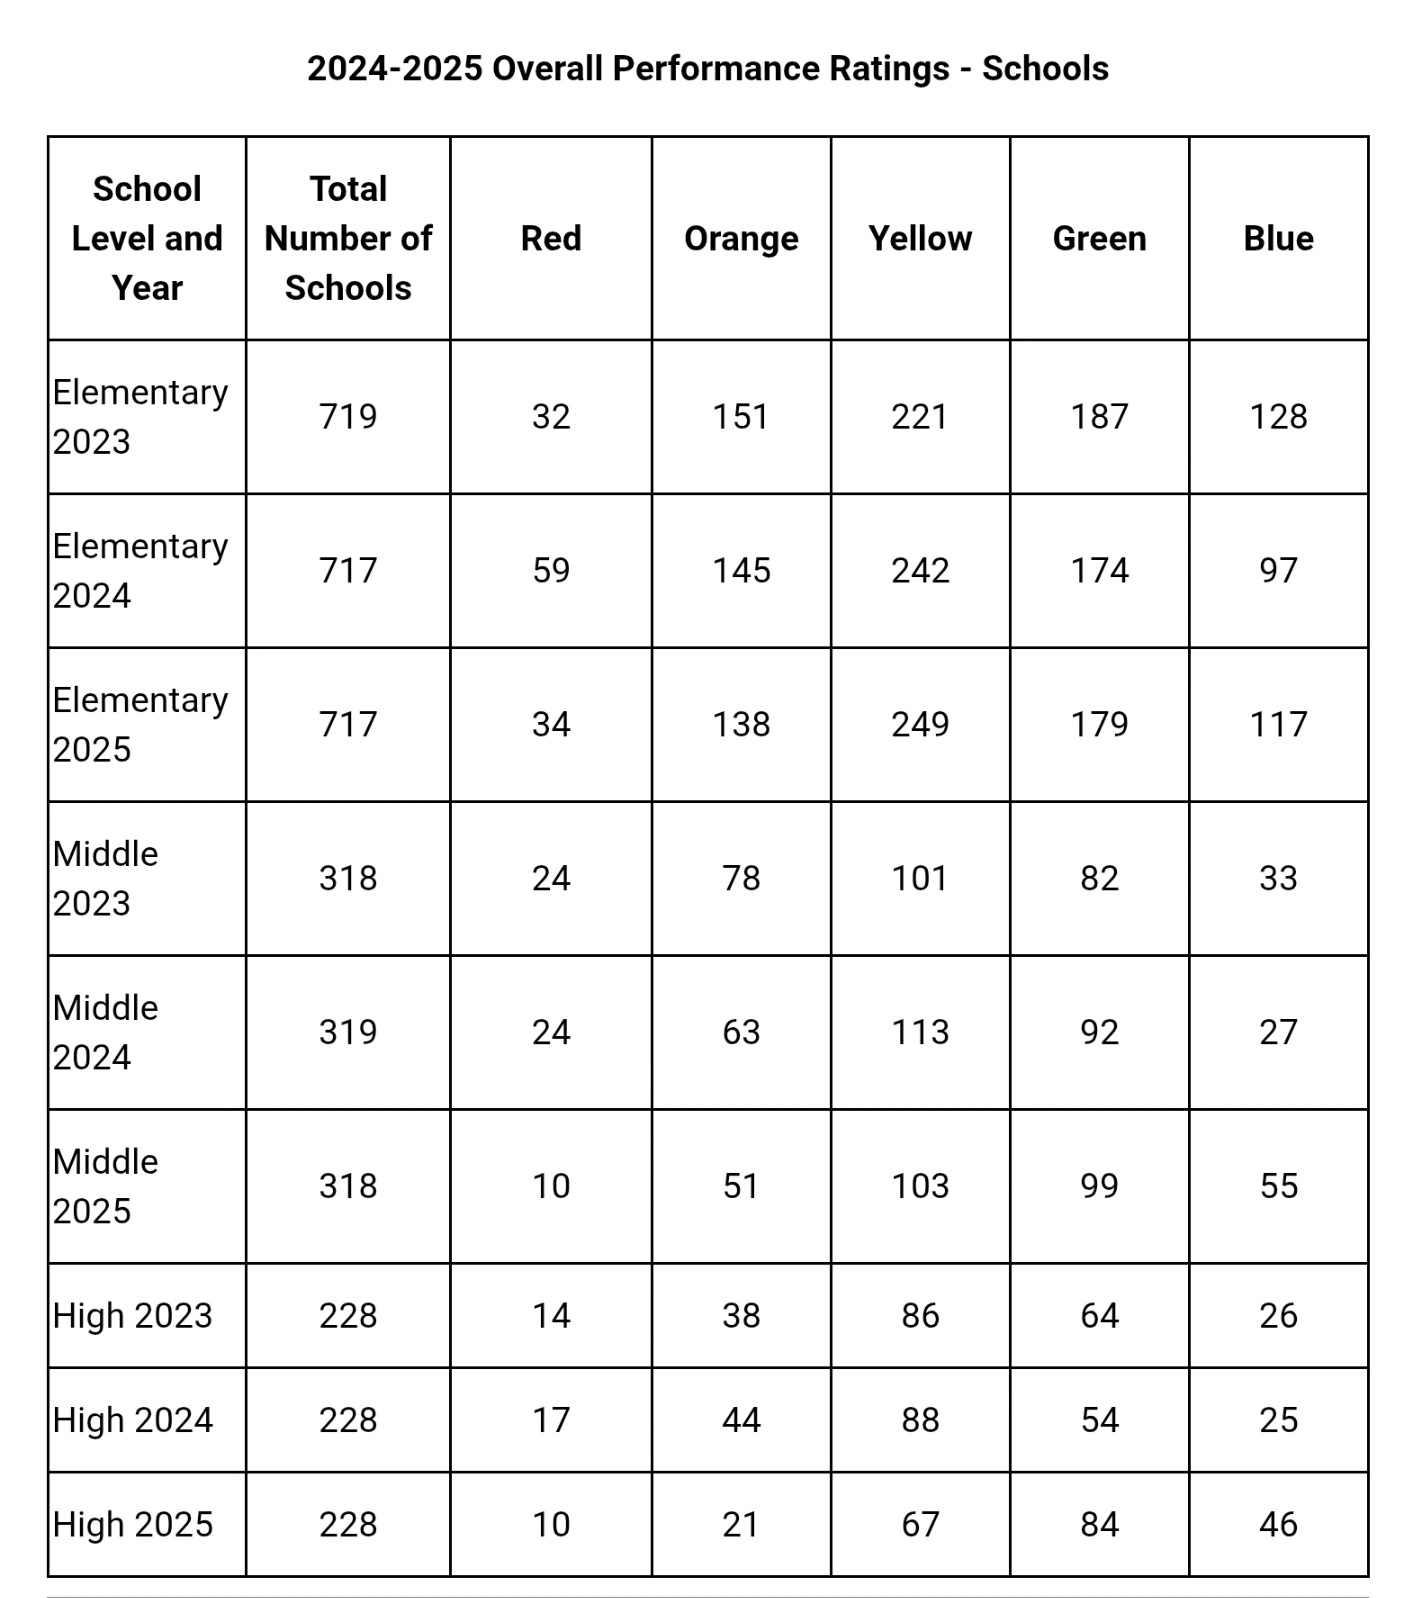
Among the overall performance ratings in 2024-2025, Kentucky elementary schools saw a rise in the three highest color ratings compared to last year. Middle schools showed a notable increase in blue ratings: 55 in 2024-2025 compared to 27 in the previous year. High schools reported a sharp drop in the lower color ratings while blue ratings nearly doubled from 25 in 2023-2024 to 46 in 2024-2025.
Overall scores among students in all grade levels improved from 2024 to 2025, with gains occurring across nearly all student demographic groups in each grade level as well, most of which were also an improvement compared to 2023.
KDE Efforts Target Literacy and Numeracy
KDE has made great strides with several initiatives tied to important academic areas.
With literacy, the Kentucky Reading Academies have already rapidly advanced outcomes for early learners since the professional learning program began three years ago, according to a report from third-party evaluator ICF earlier this year.
Implemented in 2022 after the Kentucky General Assembly’s passage of Senate Bill 9, also known as the Read to Succeed Act, the Kentucky Reading Academies aim to transform literacy instruction across the state by offering an opt-in, no-cost professional learning opportunity to both K-5 educators and administrators.
The goal behind the academies is to promote educators’ knowledge, beliefs and classroom instruction in evidence-based literacy practices to improve student reading outcomes. Facilitated by KDE’s Division of Early Literacy, the academies provide access to Lexia’s Language Essentials for Teachers of Reading and Spelling, better known as LETRS, an evidence-based professional learning that is rooted in the science of reading.
KDE also supports districts with the adoption of high-quality instructional resources (HQIRs) and started providing coaching to educators through state literacy coaching specialists in the 2024-2025 school year. Other KDE efforts to improve literacy in Kentucky include improved alignment to the science of reading for preservice teachers in educator preparation programs, the establishment of the Kentucky Early Literacy Leadership Network, competitive grants for educators to support literacy and the new Kentucky Reading Research Center.
KDE and various partners have initiated numerous efforts to advance access to high-quality numeracy instruction, per the Kentucky Numeracy Counts Act. The Kentucky Center for Mathematics’ K-5 Numeracy Counts Academy and the Partnership Institute for Math and Science Education Reform’s (PIMSER’s) Numeracy Counts Administrator Academy began in 2025, along with other professional development opportunities for educators and administrators, including an expansion of AdvanceKentucky’s Access to Algebra and EPIC’s Kentucky Numeracy Alliance pilot program. More information on district and school implementation can be found on KDE’s Kentucky Numeracy Counts webpage and the Kentucky Numeracy Counts Act implementation timeline guidance document.
Assessment and Accountability
The 2024-2025 school year marks the first time Kentucky’s school accountability system has three years of Change data available, enabling full implementation of the Change calculation for federal accountability determinations, as required by KRS 158.6455.
This year, Kentucky’s accountability system introduces two distinct calculations. While both federal and state indicator scores use Status and Change, they differ in how Change is calculated and applied. The state Change score is a simple year-to-year comparison, while the federal Change score is a three-year average of Change scores using current- and prior-year Status scores, offering a view of performance over time.
The state calculations determine color ratings for schools, while the federal calculations determine which schools are the lowest performing for potential classification such as Comprehensive Support and Improvement (CSI), Targeted Support and Improvement (TSI) and Additional Targeted Support and Improvement (ATSI).
Kentucky’s accountability system uses six indicators. At all levels (elementary, middle and high school), these indicators include:
- State assessment results in reading and mathematics;
- State assessment results in science, social studies and writing;
- Quality of school climate and safety; and
- English learner progress.
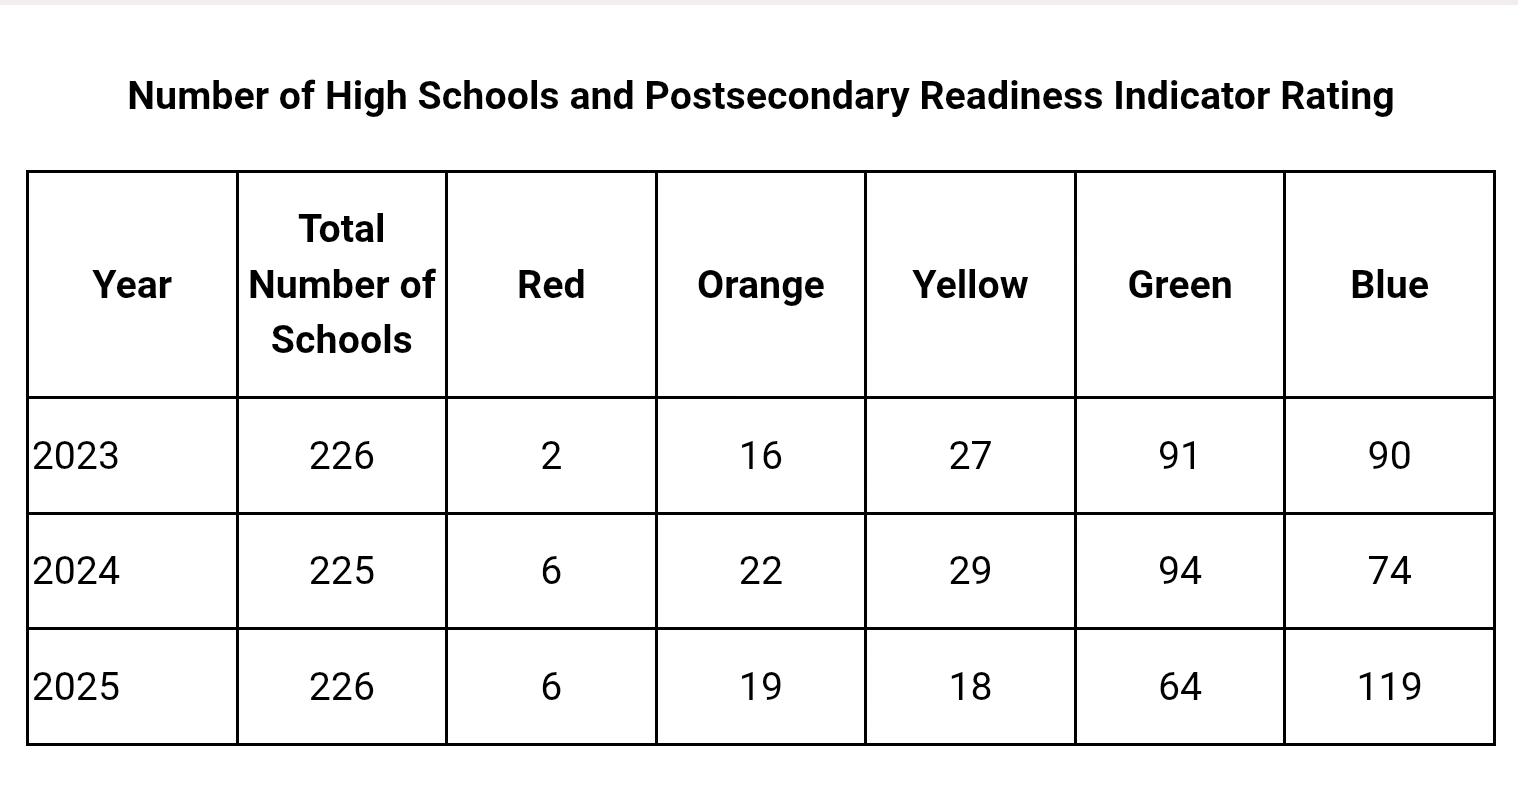
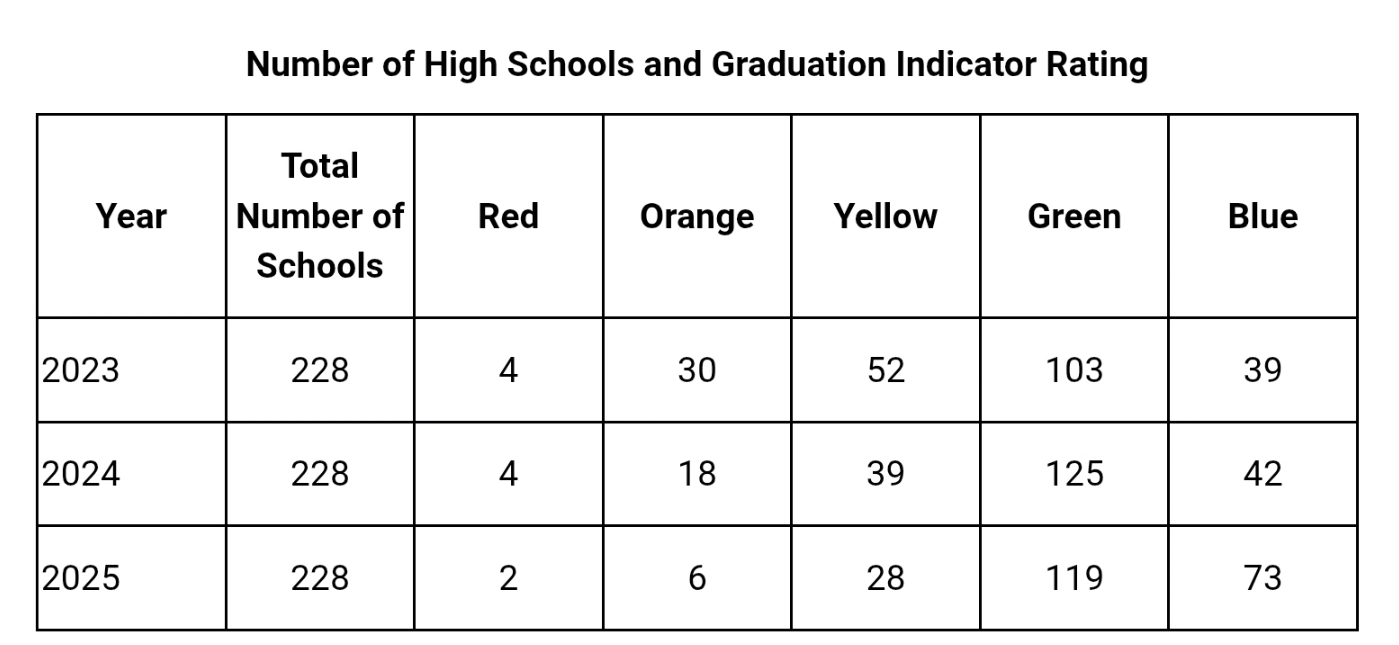
Additional indicators at the high school level include postsecondary readiness and a combination of 4-year and 5-year graduation rates.
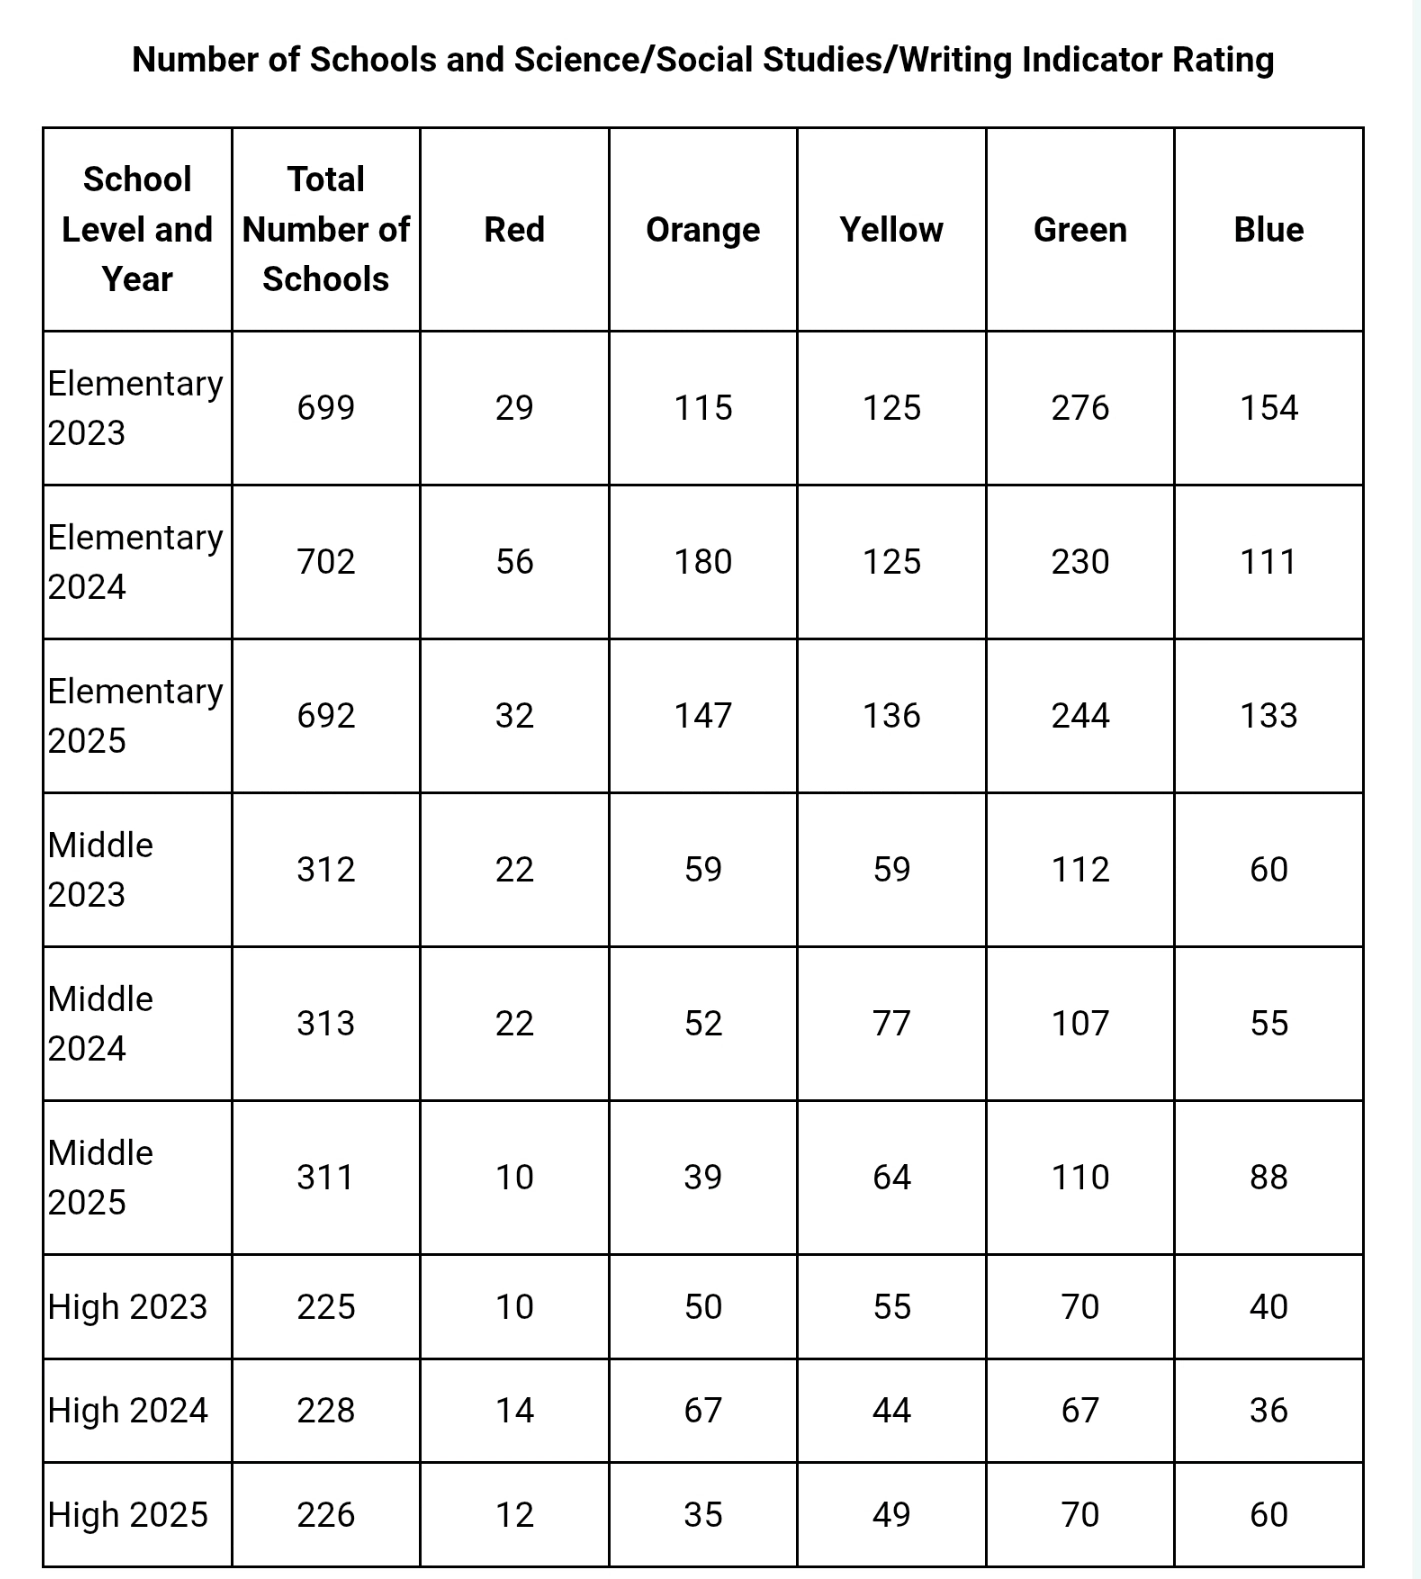
Kentucky recently re-examined how it measures student learning in science following updates to the Kentucky Academic Standards for Science in 2023 that emphasize deeper learning and the application of scientific practices. A new science assessment was developed to align with these standards, focusing on students’ ability to investigate, analyze and apply scientific concepts. The 2024-2025 school year was the first year of the new science assessment.
Kentucky educators played a critical role in creating the assessment and shaping its implementation. Teachers helped define performance level descriptors, clarifying what it means for students to perform at novice, apprentice, proficient or distinguished levels. They also participated in setting the cut scores that determine the score ranges for each level.
“This collaborative process ensures that assessment results are meaningful, fair and grounded in classroom experience,” Fletcher said.
Assessment and accountability data will first be available on Open House. The 2024-2025 assessment and accountability data will be available on the Kentucky School Report Card dashboard at 7 a.m. ET on Nov. 19.
Progress on Educator Workforce Shortages
Kentucky is seeing progress on another one of KDE’s top priorities: addressing the educator workforce shortage.
KDE conducted the 2025 Kentucky Educator Shortage Survey and the data shows 34 districts reported having no unfilled certified, classified or licensed positions within their district as of Sept. 1. This represents 20% of the survey’s respondents, which were Kentucky’s 171 school districts, the Kentucky School for the Blind, the Kentucky School for the Deaf and the Kentucky Tech System.
Last year, only one district reported having no unfilled positions.
KDE and GoTeachKY kicked off a new campaign this year seeking to elevate and celebrate the profession while inspiring the educators of tomorrow, including billboards showcasing GoTeachKY ambassadors, a compelling television commercial and an updated GoTeachKY website designed to provide resources and information for aspiring and current teachers.
“As the agency in charge of K-12 public education in the Commonwealth, we must be vigilant in targeting areas that are crucial to the success of our students,” Fletcher said. “It is a great sign that a lot of our efforts are already bearing fruit, but the hard work is just getting started.”
Chronic Absenteeism
Another priority for KDE is addressing chronic absenteeism, which is defined as when a student misses 10% or more of their time in school, including both excused and unexcused absences. Data from the 2024-2025 school year shows another year of progress with more kids in the classroom.
In 2024-2025, Kentucky’s chronic absenteeism rate was 25%, a drop from 28% in 2023-2024 and 29.8% in 2022-2023.
“The steps Kentucky schools have taken in recent years to bring kids into the classroom and keep them engaged in learning, along with the efforts of us here at KDE to bring more public awareness to chronic absenteeism, have already made a difference,” Fletcher said. “Chronic absenteeism has been a problem for quite some time, long before COVID-19, but certainly the pandemic accelerated the issue. I am excited to see how much progress we can make in the future to reduce the rate of chronic absenteeism even further.”
KDE launched a renewed public messaging campaign in 2025, which included a commercial and ads strategically placed on streaming services, websites, public transportation services, event venues and billboards across the Commonwealth. The ads featured messaging about how students belong in the classroom – You Belong! – and when a student misses school, they miss more than lessons, they miss connection with their school community and building their future. This followed a campaign in 2024 with similar messaging and efforts to raise awareness about the impact of missing class.
“We want all students to feel that school is a welcoming and supportive place for them where they can learn and grow,” Fletcher said. “Kentucky’s public school educators help students learn the skills they will need to find success in their life. That’s why KDE is All In for keeping Kentucky’s kids in the classroom and on their path to success.”
KDE also provides resources on the Attendance Matters chronic absenteeism webpage for families, community members and educators. Guidelines on when to keep your child home due to an illness, steps communities can take and other information to help promote attendance in schools are just a few of the many helpful resources available on the webpage.
Graduation Rate
The graduation rate indicator is consistent with previous accountability systems. Using the federal definition, the percentage of students earning a regular high school diploma is compared to the cohort of students starting in grade 9.
Kentucky uses a 4-year adjusted cohort rate and an extended 5-year adjusted cohort in accountability, which recognizes the persistence of students and educators in completing the requirements for a Kentucky high school diploma.
The 4-year and 5-year rates are averaged for accountability reporting. Kentucky’s 4-year graduation rate in 2025 was 93.5% and the 5-year rate was 94.2%. Both numbers were an improvement from each of the last four years.
School Climate and Safety
The quality of school climate and safety indicator is designed to measure the school environment. Perception data from student surveys is used to give insights into the school environment.
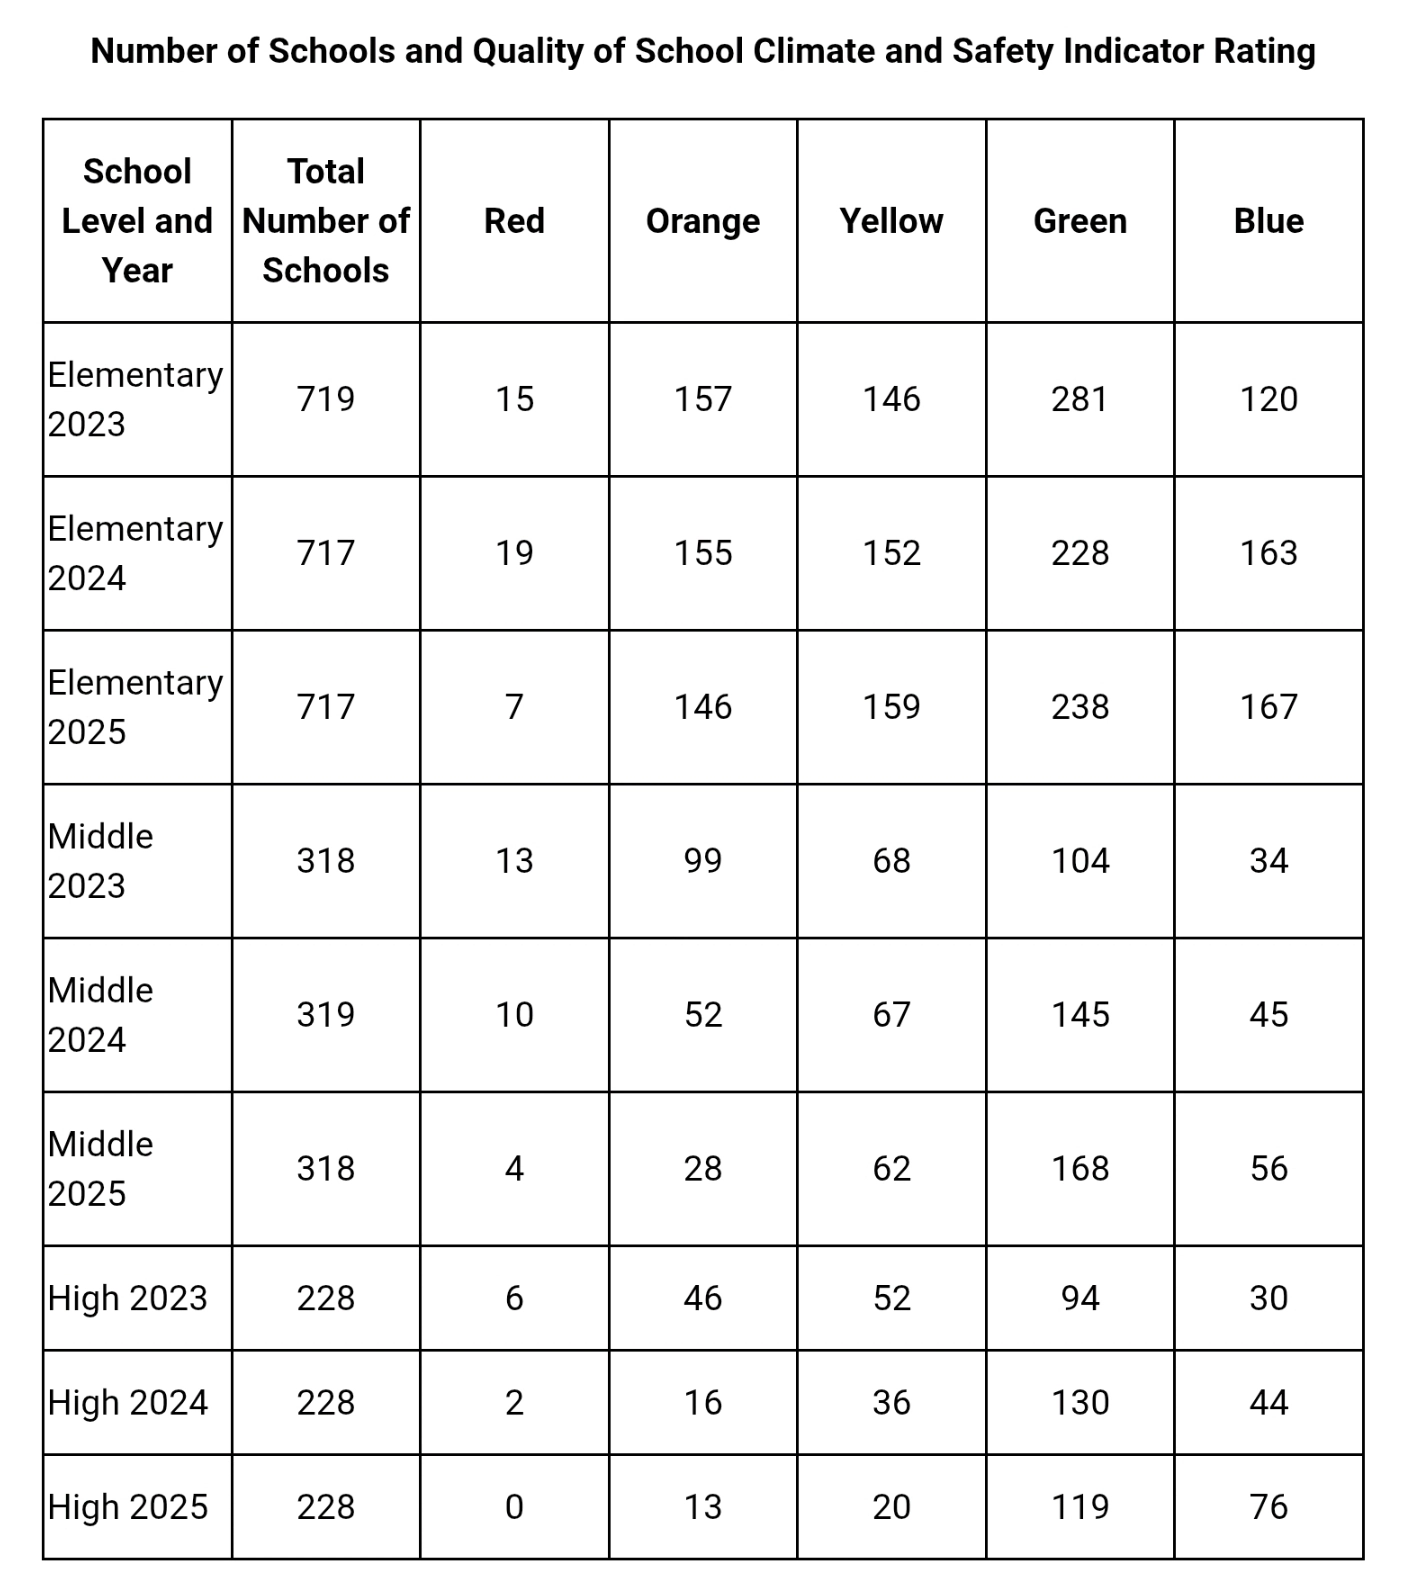
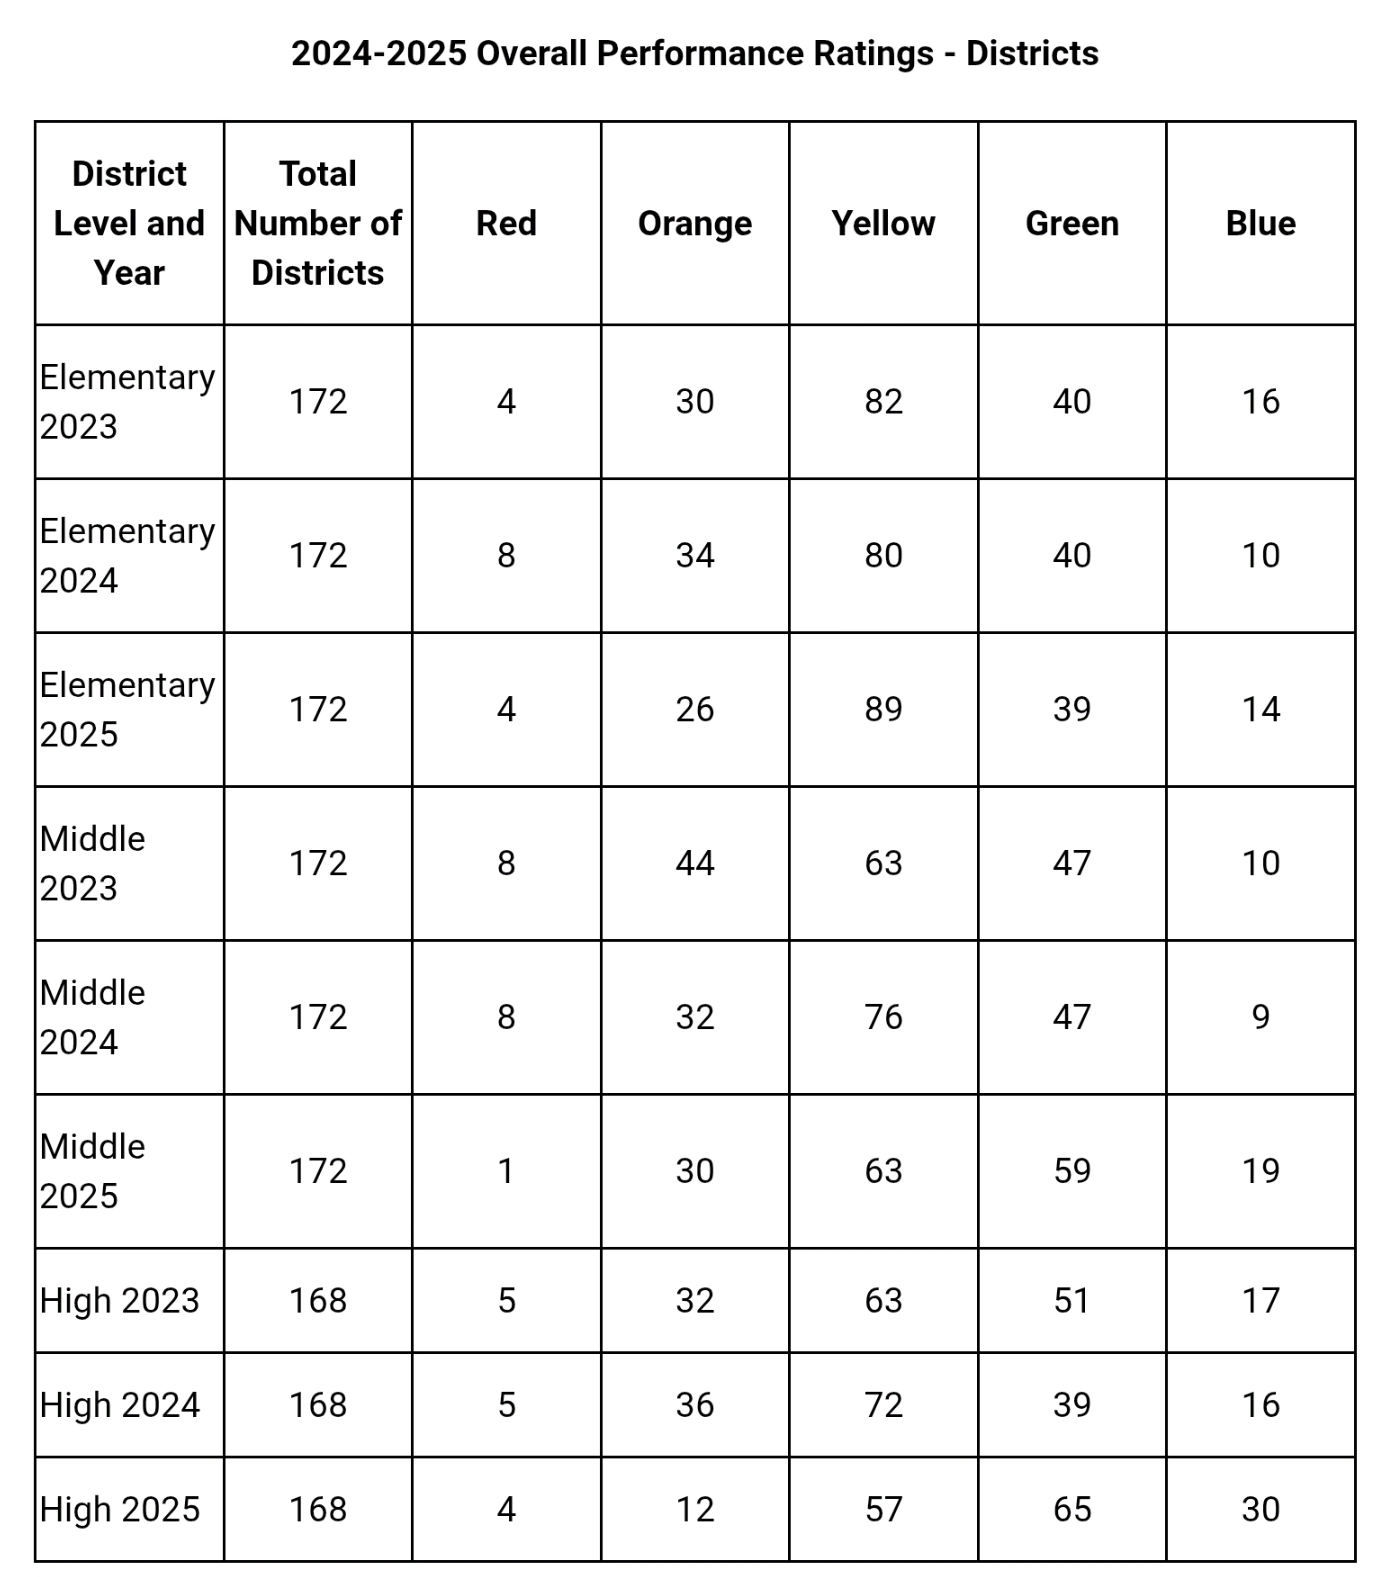
In the 2024-2025 academic year, more Kentucky school districts earned the highest ratings of green and blue than in 2023-2024. In high school, more schools moved into the top blue rating in 2024-2025 – a total of 76 compared to 44 in the previous year – which accompanied a decline across the other ratings.
“In order to educate our students properly and provide a quality learning environment, our kids need to feel safe,” Fletcher said. “Our efforts to improve school safety are ongoing, and to see that students feel even safer in our schools means our efforts are working.”
No high schools were in the bottom red rating, and 2024-2025 marked the year with the fewest overall schools in red.
Federal Classifications: CSI, TSI and ATSI
Comprehensive Support and Improvement (CSI), Targeted Support and Improvement (TSI) and Additional Targeted Support and Improvement (ATSI) are federally mandated school identifications that are based on the overall school score that is generated by the state accountability system.
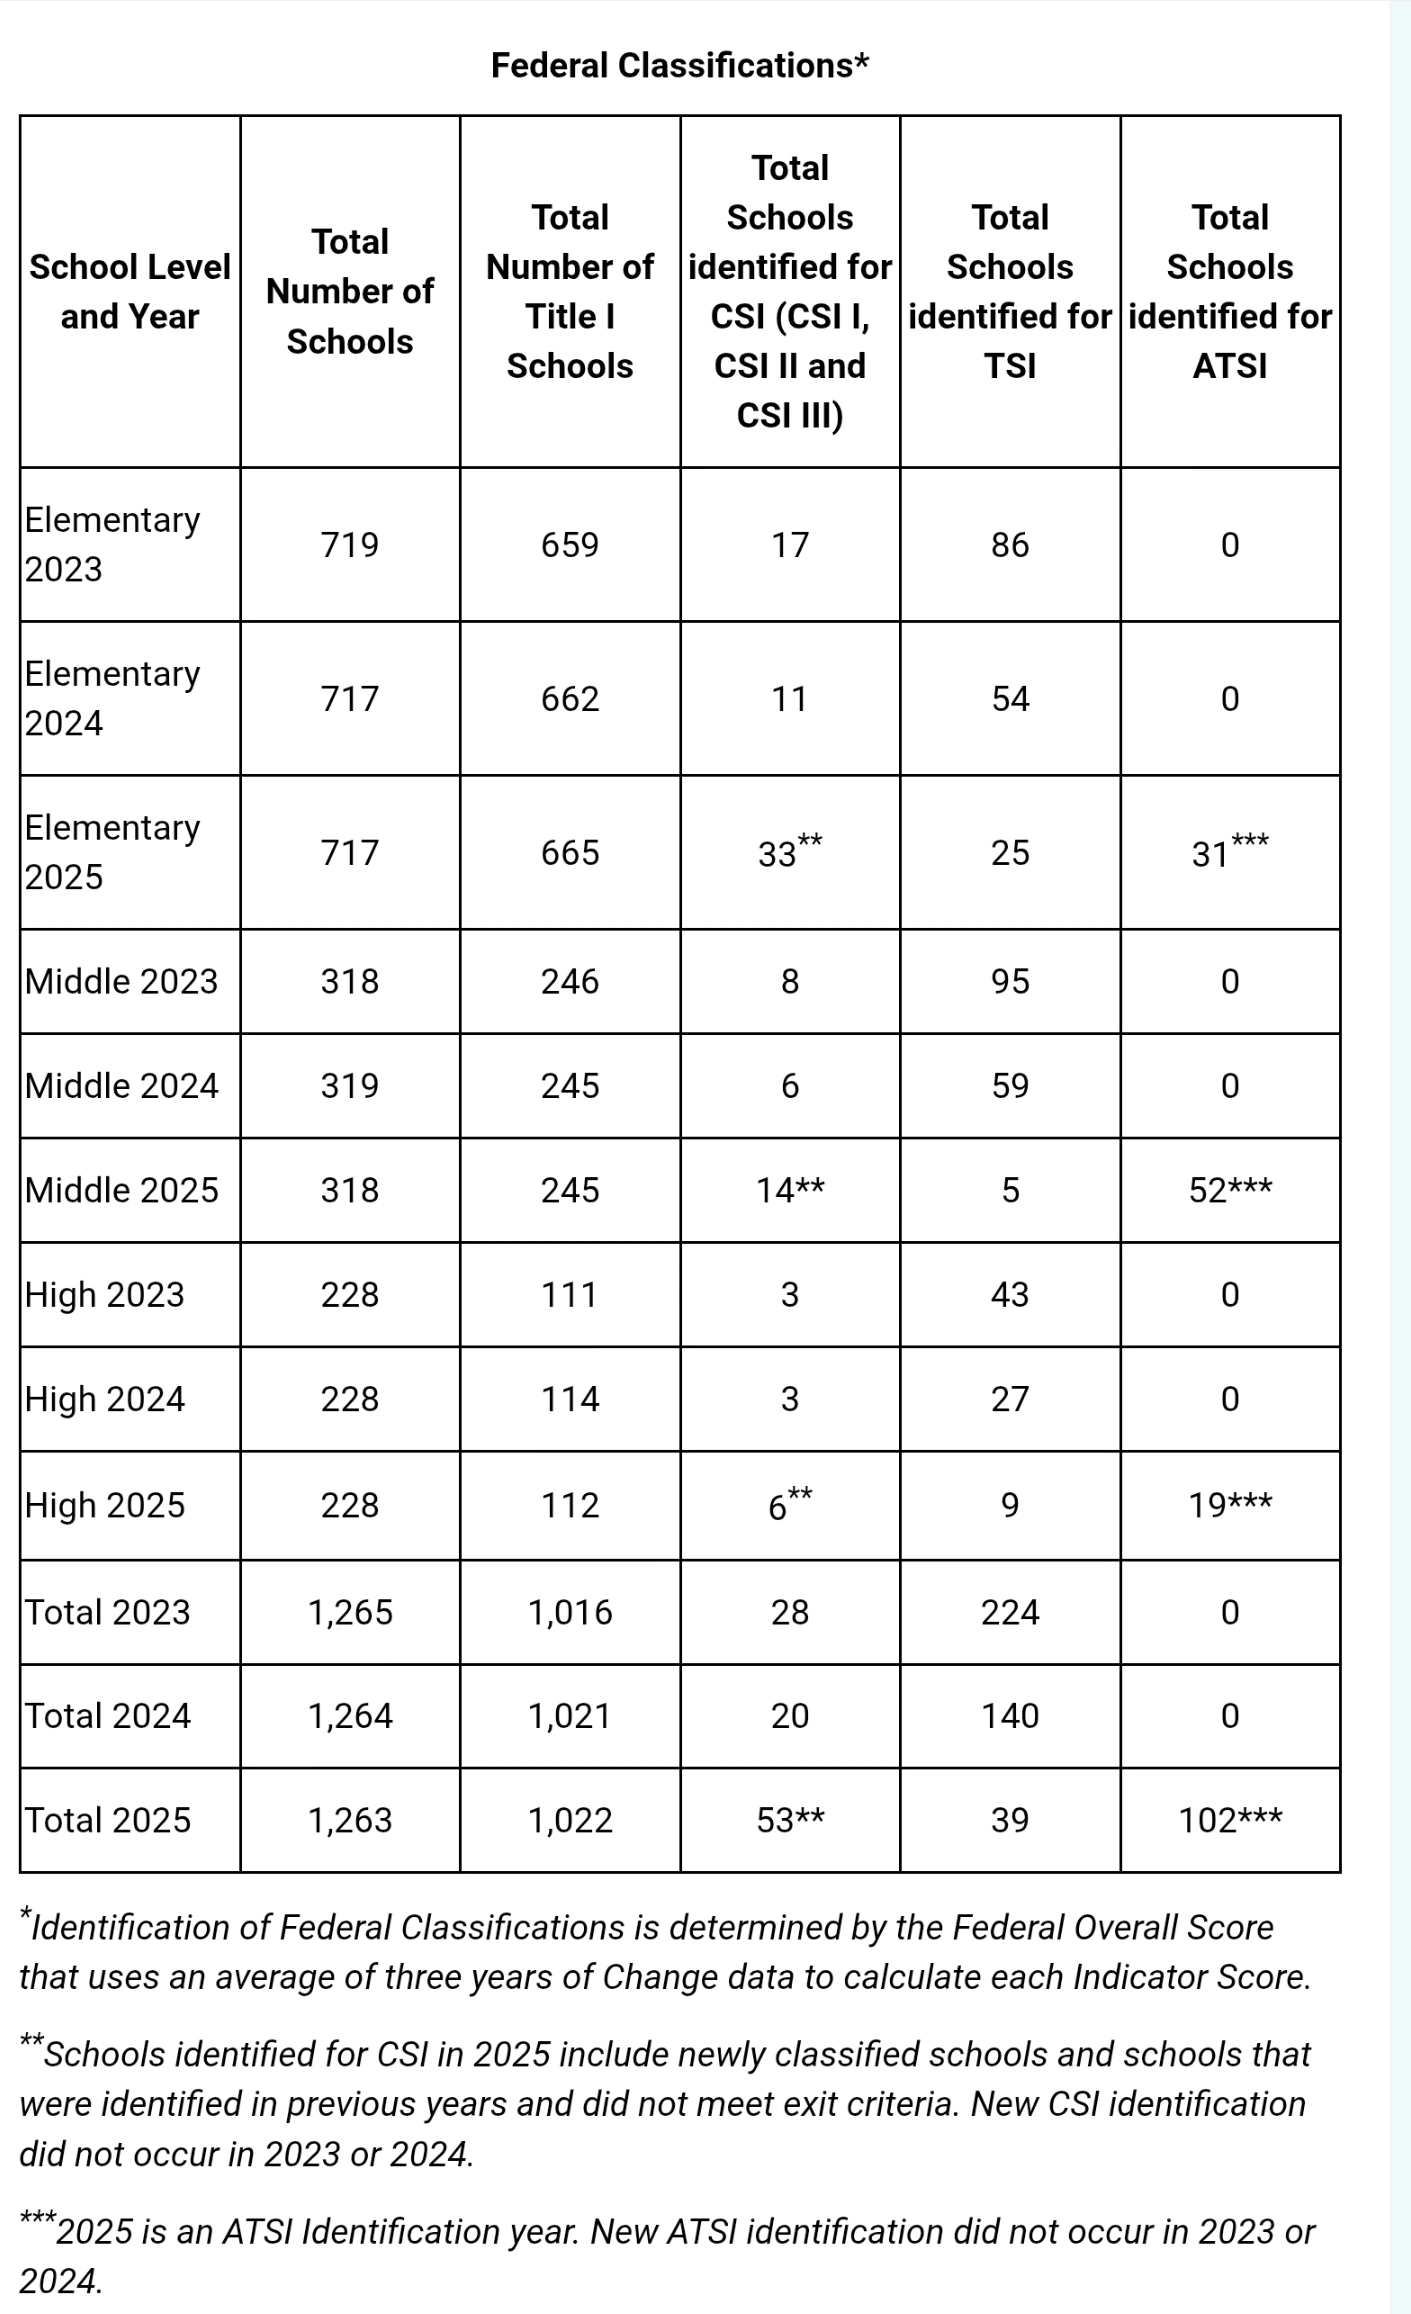
Schools have been identified for CSI and ATSI on a three-year cycle. This year is the year new schools are identified, so the number of schools identified this year should not be compared to last year. Following the passage of House Bill 298 (2025), KDE will identify new CSI schools on an annual basis moving forward. ATSI schools will remain on a three-year identification cycle.
CSI status schools were identified based on three criteria: If the school is in the bottom 5% of all schools by level based on the overall school score; if they have a graduation rate below 80%; or if they fell under ATSI status for at least three years. A total of 53 schools were identified as CSI schools in 2025, including schools that were identified previously and did not meet exit criteria.
Schools that were identified for TSI in the immediately preceding year and continue to have an underperforming subgroup of students were identified for ATSI. One hundred two schools were identified for ATSI.
TSI schools are those that have a student group performing at or below the bottom 5% of all schools by level for three consecutive years. TSI schools are identified annually and will be identified this fall based on the last three years of data, as required by state law.